

Day Trading the 30-Minute Time Frame: A Complete EMA, MACD & RSI Strategy
Trading the 30-minute (M30) chart sits in a sweet spot for many part-time and full-time traders. It's slow enough that you're not glued to the screen every minute like a scalper on the M5 or M15, but fast enough that you can still get several trade setups per week without waiting days for a position to play out. This guide walks through a complete M30 day trading strategy built around three moving averages, MACD, and RSI — including the logic behind each indicator, exact entry and exit rules, a worked example, and the risks you need to manage.
Why the 30-Minute Chart?
The 30-minute chart filters out a lot of the noise you see on lower time frames. A single candle represents half an hour of real market activity, so random spikes and stop-hunts that plague the M5 and M15 charts have less influence on your decision-making here. At the same time, M30 still moves fast enough to generate multiple setups per week on a liquid pair like EUR/USD or GBP/USD, making it practical for traders who can check charts every hour or two rather than sitting at the desk all day.
The Indicators and Why Each One Is There
This strategy layers three types of indicators, each doing a different job:
Three Exponential Moving Averages (EMAs)
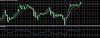
- 6-period EMA (blue) — tracks very short-term price momentum
- 20-period EMA (green) — represents the medium-term trend
- 21-period EMA (red) — works alongside the 20-period EMA as a secondary trend filter
When these three EMAs stack in order and price sits cleanly on one side of them, it signals that short, medium, and longer-term momentum are all pointing the same direction — a stronger signal than any single moving average could give alone.
MACD (3, 26, 1) The MACD line crossing above or below the zero line tells you whether momentum has shifted from bearish to bullish (or vice versa) on a broader scale than the EMAs alone capture. It acts as a confirmation filter: this strategy only takes trades in the direction MACD is currently pointing.
RSI (10-period) RSI here isn't used the way most traders use it — to time reversals at extreme overbought/oversold levels. Instead, it's used as a trend confirmation filter, keeping you out of trades where momentum has already stretched too far in one direction, using the standard 30 (oversold) and 70 (overbought) thresholds.
Trading Rules
Buy Setup
- MACD line is above the zero line
- RSI is between 30 and 70 (not in extreme territory)
- The candle closes clearly above the EMA cluster
- The blue (6 EMA) and red (21 EMA) lines are visibly separated on the chart, not tangled or overlapping with the green EMA
Sell Setup
- MACD line is below the zero line
- RSI is between 30 and 70 (not in extreme territory)
- The candle closes clearly below the EMA cluster
- The blue (6 EMA) and red (21 EMA) lines are visibly separated on the chart, not tangled or overlapping with the green EMA
The fourth condition matters more than it might seem. When the EMAs are tangled together, the market is likely ranging or transitioning between trends — exactly when this kind of trend-following setup produces the most false signals. Waiting for clean separation between the EMAs filters out a large share of low-quality trades.
Exit Strategy and Risk Management
- Stop loss: Place it at the most recent swing point (the last clear turning point in price before your entry). This keeps your risk tied to actual market structure rather than an arbitrary fixed number of pips.
- Take profit: Target a risk-to-reward ratio of 1:2 to 1:3. If your stop loss is 20 pips away, look to take profit at 40–60 pips.
- Alternative exit: Close the trade early if price closes back inside the EMA cluster, since that often signals the trend driving your trade is losing steam before it hits your formal stop or target.
As with any strategy, never risk more than 1–2% of your account on a single trade, and always confirm your position size matches your stop-loss distance before entering.
Worked Example
Imagine EUR/USD is trading on the M30 chart. MACD has just crossed above the zero line after several hours below it. RSI reads 55 — comfortably in the middle of the range, not overbought. Price prints a candle that closes clearly above the EMA cluster, and you can see the blue 6-EMA has pulled away from the red 21-EMA rather than sitting on top of it.
That's a valid buy signal. You'd mark the most recent swing low as your stop-loss level, and if that's 25 pips below your entry, you'd set a take-profit roughly 50–75 pips above entry for a 1:2 to 1:3 reward-to-risk trade.
Strengths and Limitations
Strengths:
- The multi-indicator confirmation (EMA + MACD + RSI) reduces false signals compared to using any one indicator alone
- Works on liquid major and minor forex pairs
- Time frame is practical for traders who can't monitor charts constantly
Limitations:
- Like all trend-following systems, it will produce losing trades during choppy, range-bound markets — no combination of indicators eliminates this
- Requires discipline to wait for all four conditions to align rather than jumping in early
- Past performance of any indicator combination doesn't guarantee future results; backtest on your specific pairs before trading live
Final Thoughts
This EMA/MACD/RSI combination gives structure to M30 day trading by requiring agreement across trend, momentum, and overextension filters before you take a trade. No strategy wins every time, so treat these rules as a framework for consistency rather than a guarantee — and always test any system on a demo account before risking real capital.
This article is for educational purposes only and does not constitute financial advice. Forex trading carries a high level of risk and may not be suitable for all investors.



0 Comments